How ACL are utilising Power BI to revolutionise slot data for our airport customers.
By Shahbaz Bhatti – Airport Slot Coordinator
Data Analytics has come a long way over the last decade and the aviation industry has been quick to benefit from the wealth of information available. Whilst it is good to have access to huge sets of data, however, being able to uncover insights or visualise this to a non-technical audience is often more challenging. To achieve this Airport Coordination Limited (ACL) have invested in Microsoft Power BI (PBI) to present our valuable data. PBI is a Microsoft business intelligence tool which allows users to connect multiple sources of data into powerful and interactive visuals that can be shared and collaborated on to inform important decision making.
Uses in the Aviation Industry
PBI is widely used within the aviation industry. Some of our biggest customers, including Heathrow Airport Ltd and Manchester Airport Group, have heavily invested in PBI to provide them ‘on the go’ data to drive their business needs. Click here to view an article and video where the CIO of Heathrow Airport Ltd describes how PBI has helped their day-to-day operations. Over the last two years, more of our airport and airline customers have started to invest in PBI; allowing us to collaborate better, provide more insightful analytics and enhance our service by providing reports in ways never seen before.
How ACL Utilise PBI:
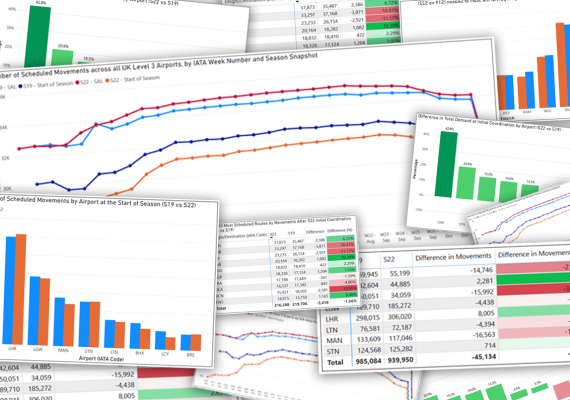
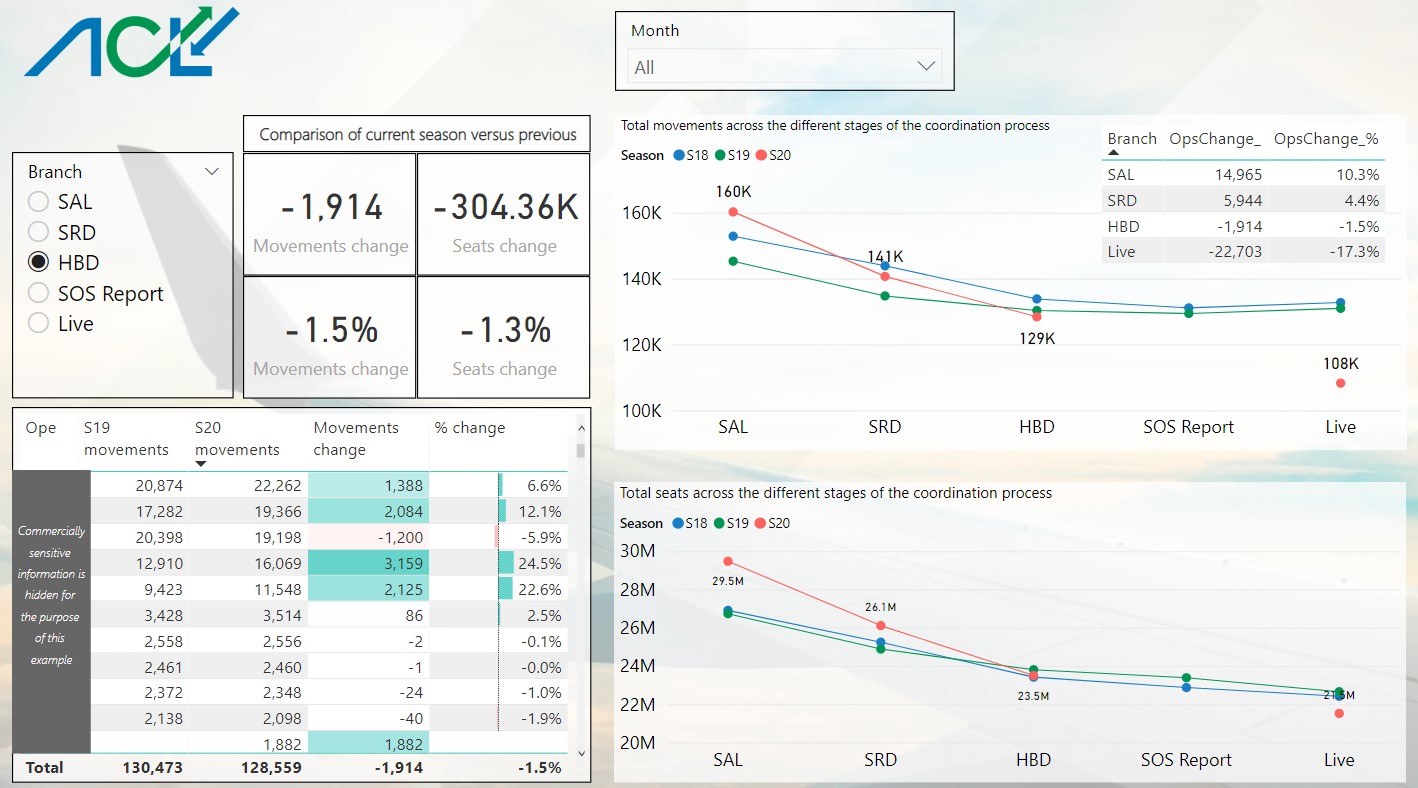
ACL’s database is a comprehensive portfolio of airport slots. This asset is the fundamental driver of databases, operations, and resources for all our airport customers. As well as populating Flight Information Display Systems (FIDs), the raw data can be analysed and manipulated in ways to provide useful insights for various themes. ACL has used this data to create reports related to coordination activities, growth forecasts and slot usage investigations and monitoring.
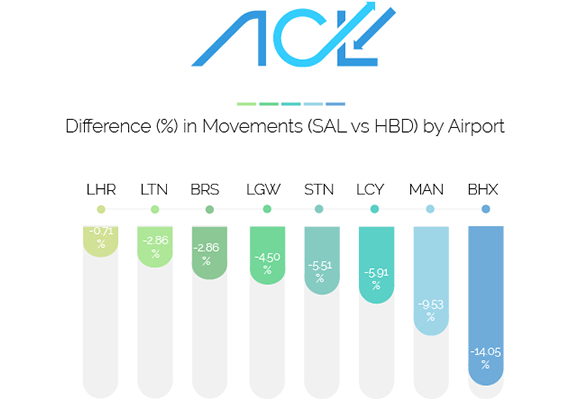
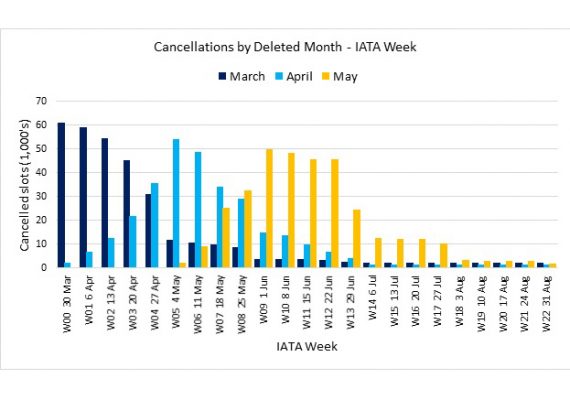
PBI has been an essential tool during the recent pandemic. To preserve their business, one of our biggest customers faced the decision to close more than 60% of their infrastructure. ACL adapted to the new environment and provided quick, precise and simple demand forecast histograms, to assist decision making on falling demand. The interactive visuals allowed users to filter different operators and terminals to understand and predict the result of various scenarios. At a time where our customers required immediate assistance, PBI has delivered on efficiency.
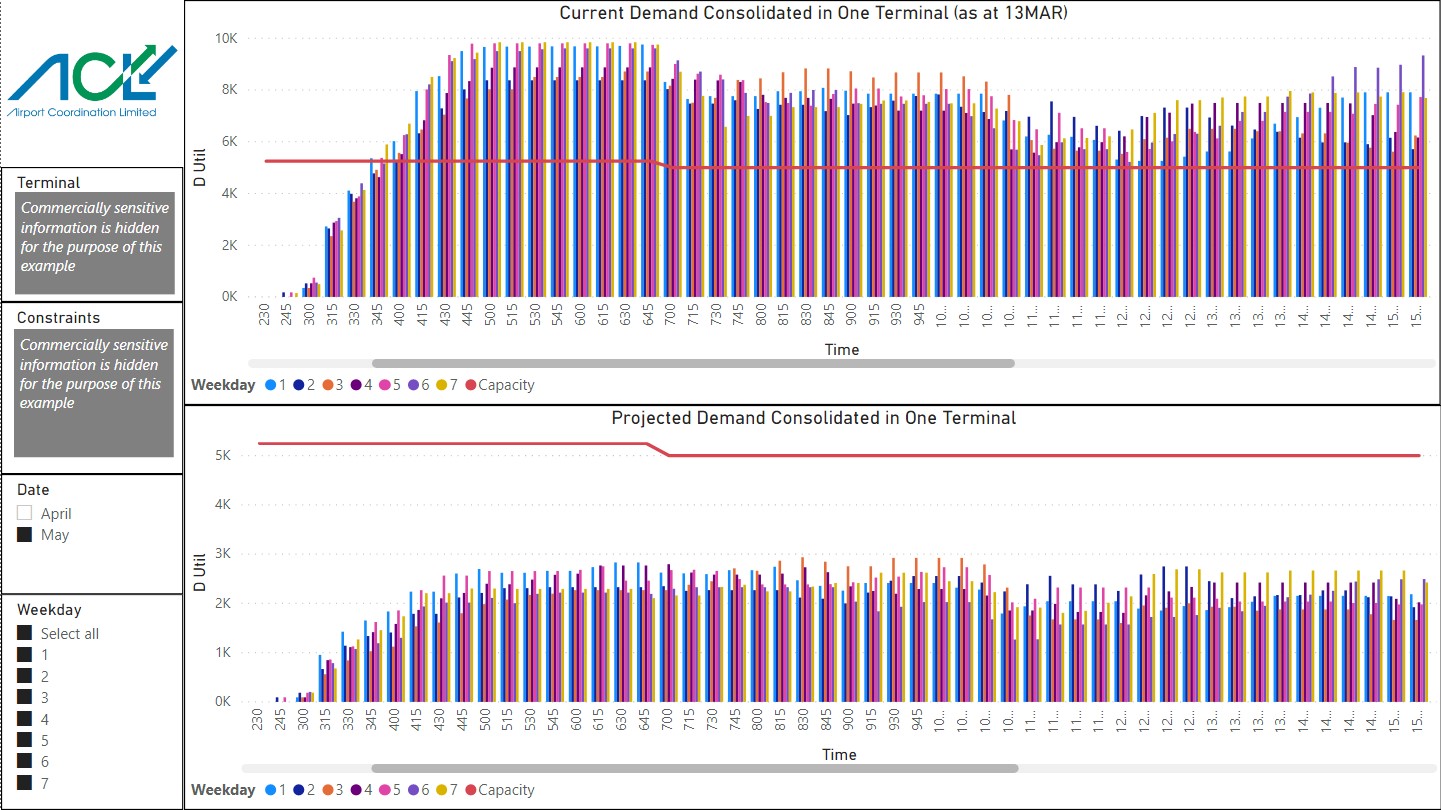
This has been equally helpful in forecasting uplifts in demand. ACL worked with the same customer to produce histograms providing scenarios for when demand returns and the impact of social distancing measures. These insights allow airport customers to make informed decisions for re-opening in the most economical way.
“ACL produced a very useful power BI report to help us better understand and analyse our flight schedules. The ability to filter by different elements of our schedule – such as terminal, airline, date, arrival or departure – gave us access to the next level of detail beyond a standard coordination report and help understand what was behind our demand. This saved lots of discussion … and made much better use of everyone’s time! It’s a tool we’d find very useful going forward.” – ACL Airport Customer
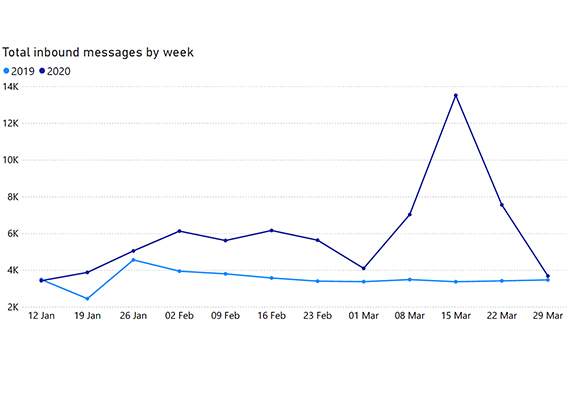
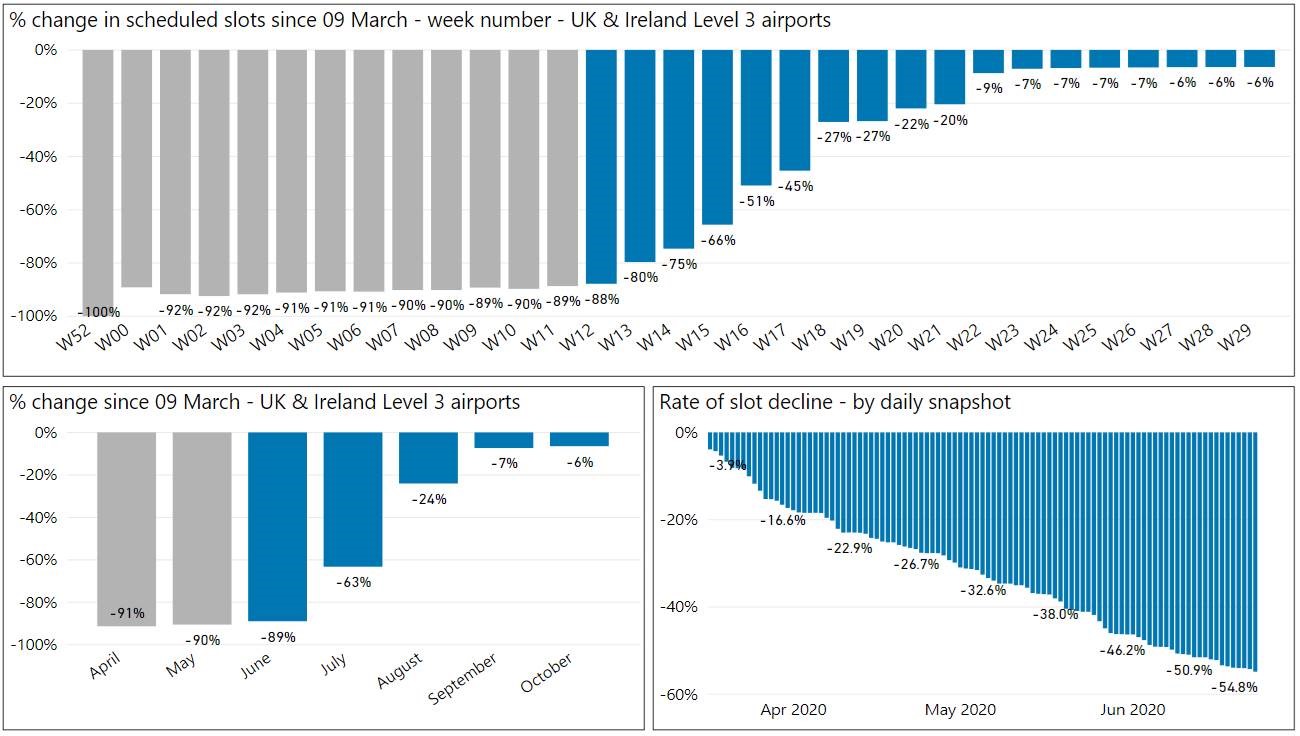
Reporting can be utilised across the aviation community for groups such as the Industry Resilience Group (IRG) and NATS. The IRG is a collaboration of leading aviation bodies looking at enhancing day to day operating resilience, reducing delays and costs. PBI is effective for them as it allows us to store, visualise and refresh data ahead of the summer season and over several iterations. By building a PBI dashboard we can enhance the raw schedule data. This provides NATS with insights into the levels of congestion and where these are likely to take place. The daily updates we provide to NATS mean they can make reliable decisions on staffing, coinciding with the fall of traffic volumes and, more recently, with the signs of ramp-up in flights. This allows them to anticipate increases in traffic and the effect this has on their own resource planning.
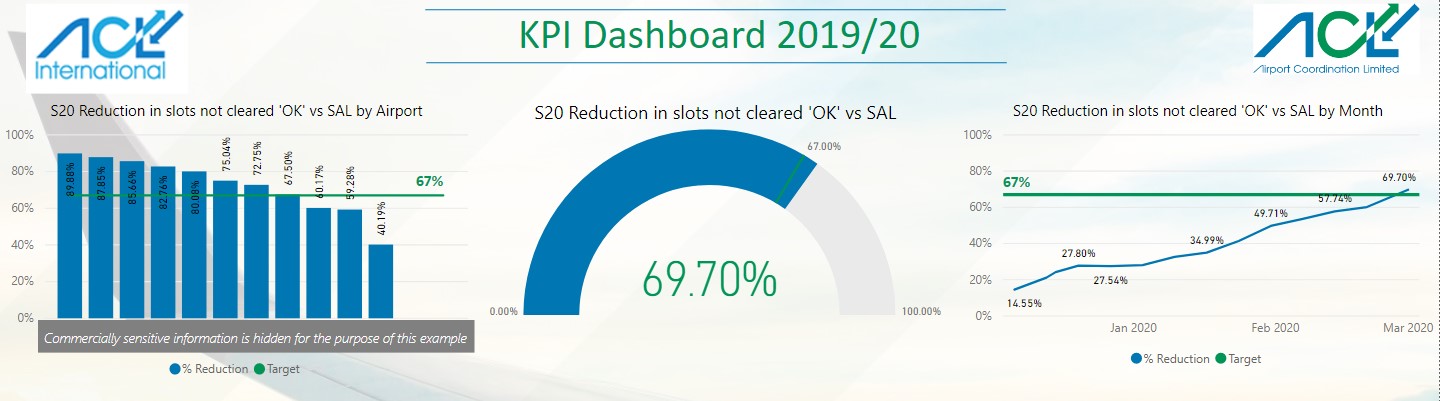
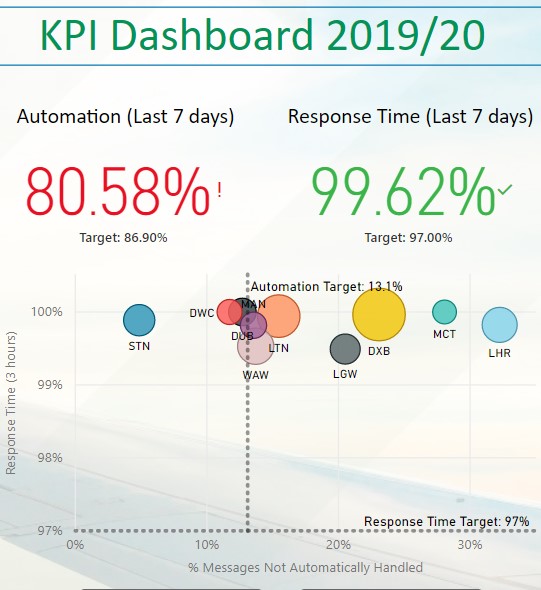
ACL also utilise PBI internally to improve our own KPI performance and help us reach our customer service goals. Combined data from our SQL and Excel databases are dynamically fed to our centralised intranet page, providing colleagues with accurate, up-to-date data which can be used to assess our own performance objectives and source solutions to benefit our customers.
Next Steps:
ACL are committed to our values and to ‘Striving for Better’. We endeavour to explore and endorse new and innovative avenues, stay up to date with industry norms and enhance our services. PBI has allowed us to expand our data analytics knowledge which will only increase through further use and collaboration, allowing us to better support our customers and the aviation industry.
If you would like to explore how PBI and ACL analytics can support your airport please email us at pbihelp@acl-uk.org.